 ISO12233 Chart |
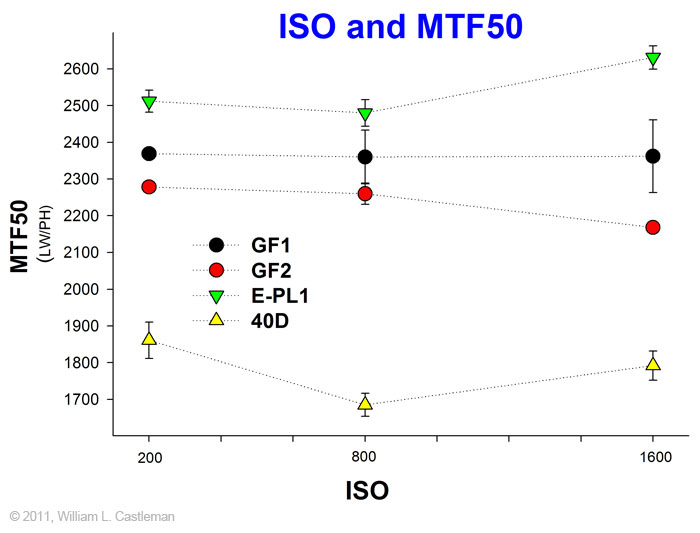 MTF50 measured from the single slant edge on the ISO12233 chart with Imatest. |
|
|
|
 SFRplus Chart |
 13 Region of Interest Pattern for Imatest Master Analysis |
Methods used with ISO12233 chart, SFRplus chart and and Imatest Master
I used the ISO12233 chart that I purchased from Applied Image, Inc. in the first tests. The chart was photographed with illumination from two modeling lamps each at 45 degrees angle. The images were taken as raw files. Raw files were converted to high resolution jpg's with LightRoom 3. Horizontal and vertical resolution were read from the patterns. Only horizontal resolution is plotted. MTF50 was calculated with Imatest Master (Slanted-edge SFR) from the top slanted edge in the pattern. Three exposures were processed for each camera at each ISO setting. A mean and standard error of the mean were calculated for each measurement with SigmaStat software.
Tests conducted with the SFRplus chart were photographed with
illumination from two modeling lamps each at 45 degrees angle. The images
were taken as raw files. Raw files were converted to high resolution jpg's
with LightRoom 3. Jpg's were analyzed with with
Imatest Master.
Three exposures were processed for each camera at each ISO setting. Images
were analyzed with a 13 region of interest pattern. MTF50 values were
summarized as a weighted mean (center - 1.0; part-way - 0.75; corner -
0.25). A mean and standard error of the mean were calculated for each
measurement with SigmaStat software.
GF1, GF2 and E-PL1 cameras, a
Panasonic 20mm f/1.7 lens was used at f/5.6. An EF 50mm f/1.4 lens at f/8
was used with the EOS-40D.
ISO12233 Chart |
MTF50 measured from the single slant edge on the ISO12233 chart with Imatest. |
|
|
|
SFRplus Chart |
13 Region of Interest Pattern for Imatest Master Analysis |