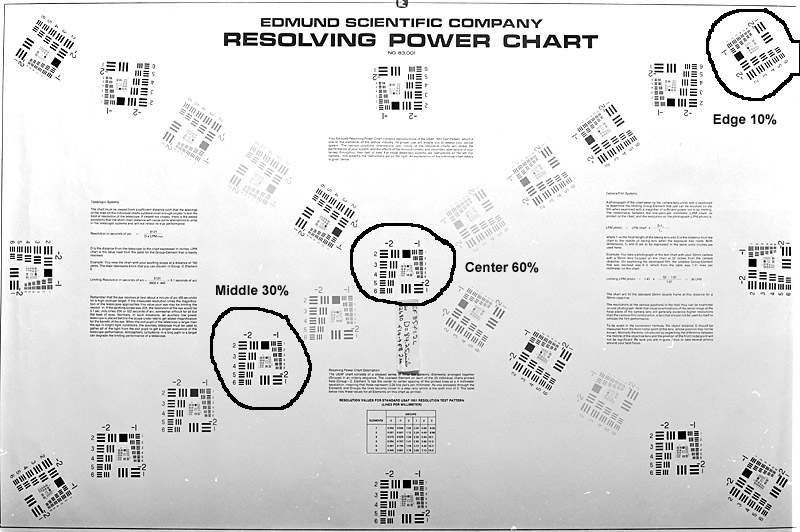
 Edmund Scientific Lens Resolution Chart |
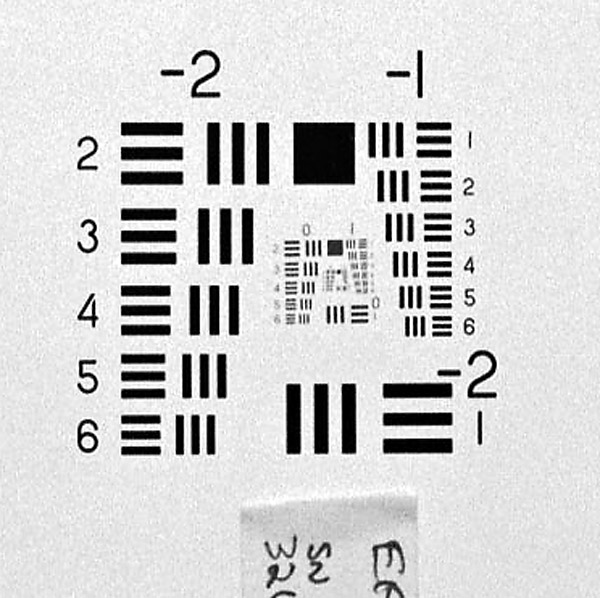 Detail of USAF 1951 test pattern |
Testing Lenses to Determine Resolution on Film and 50% MTF with an EOS-1Ds
Lens Resolution on Kodak Technical Pan Film:
Resolution tests were run at 35.5 inches from the target. An Edmund Scientific lens resolution chart was illuminated with a monolight flash adjusted with a flash meter at each aperture exposure. The lenses were mounted on a Bogen 3033/Arca Swiss B1 tripod/head combination. Three exposures at 1/250th second were taken at each aperture with an EOS-1v via cable shutter release on Kodak Technical Pan film rated at ISO 25 and developed in Technidol. The central autofocus point was centered over the center pattern for each exposure. No focus bracketing was used. In previous tests, it was determined that camera autofocus function yielded consistently higher line pairs per mm scores than trying to use manual focus and bracketing with an eyepiece magnifier. The lens was manually defocused, and then refocused using autofocus for each exposure. Line patterns were read under a compound brightfield microscope at a magnification of 40X.
Edmund Scientific Lens Resolution Chart |
Detail of USAF 1951 test pattern |
Measurement were made at the center pattern, a middle pattern, and the far upper right pattern on the four exposures. The highest resolution score for each aperture was recorded for data in the center-weighted resolution graph. Center-weighted resolution was calculated (60% center; 30% middle; 10% edge). Resolutions at each f/stop were calculated using the method on the chart as follows.
Image lines pairs per mm (image lpm or lp/mm) = lpm resolved on chart X (D-fo) / fo) where fo = focal length of lens and D = Distance from the chart to the middle of the lens.
50% MTF (modulation transfer function):
Perceived image
sharpness is more closely related to the spatial frequency (lp/mm) where
MTF is 50% (i.e., where contrast has dropped by half) than to resolution
alone. I used the EOS-1Ds and the Koren 2003 lens test chart
developed
and explained by Norman Koren to calculate 50% MTF. Printed test
charts were placed on the Edmund Scientific Test Chart as in the middle
and edge of the chart as shown
here. The chart was photographed with an EOS-1Ds under tungsten bulb
lighting at 35.5 inches so that the MTF test charts were photographed at
25 magnification. Images were shot at ISO 100, Raw mode, aperture
priority, compensation +1.3, and converted with Phase One DSLR v. 3.5.2.
The
distance from the chart was calculated at d1=(M+1)f where
d1 = lens to target distance (mm) and f = lens focal
length (mm) and M=25. This distance allowed the entire Edmund Scientific
chart to be photographed and for resolution and 50% MTF to be measured and
chromatic aberration to be detected from the same images. The imaged sine
patterns were analyzed with
ImageJ software and measurements were made on the resulting Plot
Profile to determine line pair per mm frequency of 50% contrast as
explained in detail on the Norman Koren website. Center weighted 50% MTF
was calculated (70% center, 30% edge).